eZ Flow case study: landing page for Rasmussen Reports Election 2012
By: Peter Keung | July 23, 2012 | User experience and Case study
For many media sites, news changes fast, and the timely updating of content is key. Landing pages are the main information funnel, and it is important for editors to be able to update the content shown on landing pages as easily as possible. Where relevant, content should also update itself. The Rasmussen Reports Election 2012 page is one such example, where we've empowered editors to make content and layout changes in a graphical user interface, without having to contact a web developer. In this article, we will show you how various areas of the Election 2012 page are updated using the eZ Flow extension for eZ Publish.
Manually selected featured stories
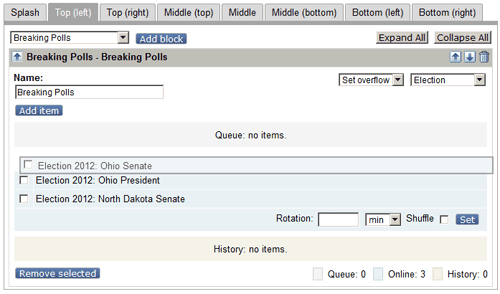
At the top of the Election 2012 landing page are breaking polls, and the latest presidential, senate, and governor polls.
These stories are manually selected by editors, and can be ordered using drag-and-drop functionality.
Modifying layout
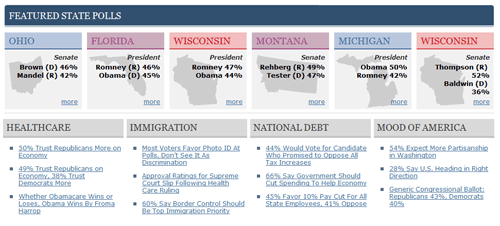
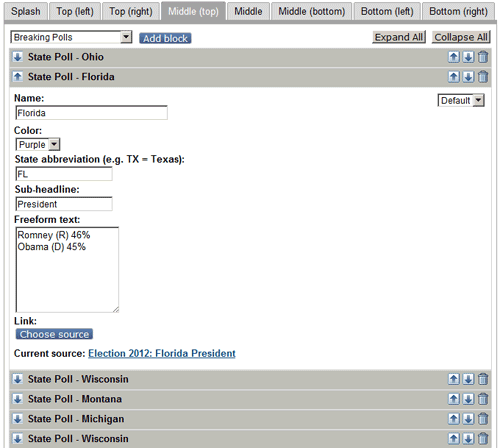
State poll summaries and articles by keyword showcase topic-based information.
The order of entire blocks is flexible and specific details of block content are fully controllable.
Automatically populated blocks
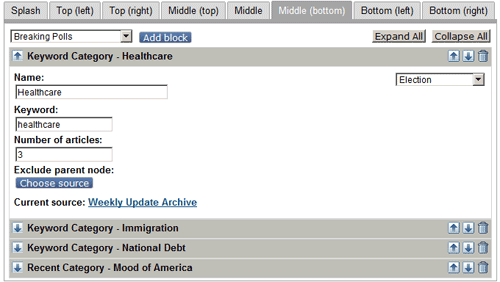
The keyword blocks, as mentioned above, are topic-based. Editors do not have to edit the article lists manually. Once a block has been assigned a keyword and a source folder, that block will automatically update whenever new content is added and tagged in the relevant subtree.
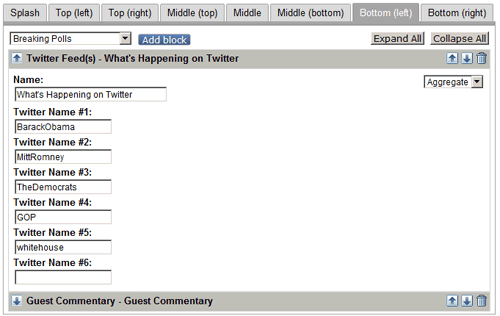
The Twitter block shows the latest Tweets from a variety of sources.
Setup is easy, requiring only a list of Twitter usernames. The page then automatically updates with the latest Tweet from each account every 10 minutes.
Edit once, update many places
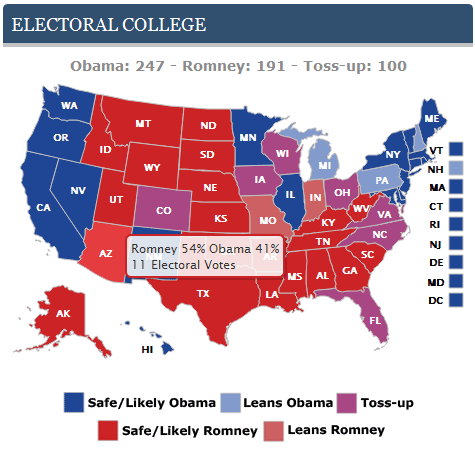
The election maps (Senate Balance of Power and Electoral College) are a great visual summary of what the latest polls indicate.
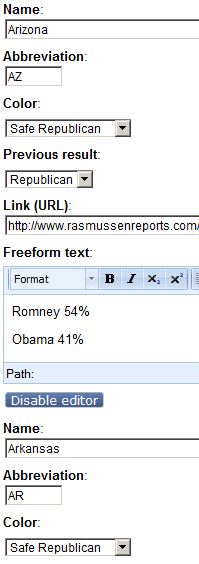
Mugo Web extended the eZ Publish edit interfaces to enable editors to modify state data for all states on one page.
Clicking anywhere on the landing page maps leads to dedicated pages, such as the Electoral College Scoreboard. This shows a bigger map and a few summary tables for those who are interested in diving deeper into the numbers. Editors only have to edit state data once; that data will automatically refresh and populate the small and big maps, as well as all of the summary tables.
By providing intuitive editorial tools to Rasmussen Reports, we've helped them to focus on providing accurate, engaging, and insightful content without being burdened by technical implementation details.


